- ThetaThrottle
- Posts
- How Illiquidity is Costing You
How Illiquidity is Costing You
Weekly Edition: September 10th, 2025
Market Movements
Weekly Return | Current Level | |
|---|---|---|
S&P 500 | 1.036% | 6,512.61 |
NASDAQ | 1.947% | 21,879.49 |
Dow Jones | 0.887% | 45,711.34 |
VIX | -13.563% | 15.04 |
Russell 2000 | 1.252% | 2,381.82 |
*Weekly Return is calculated as market open of the previous Wednesday, to market close this Tuesday (yesterday); Current Level is Tuesday’s (yesterday’s) close.
Weekly Rollout
Stocks are dancing on hopes of a rate cut, a sentiment that was boosted by labor market data. With this, traders are as close to “as sure as you can be” that rates will be cut in September. The probabilities are currently at a 94% chance of a 25 basis point cut, and about a 6% chance it is 50 basis points. Options markets are buzzing, with record S&P activity as traders crowd into bullish bets, mostly on rate-sensitive names and even meme stocks. Here we go again?
Speaking of meme stocks, it’s finally Robinhood’s time to shine. HOOD is joining the S&P 500 on September 22, after seeing its stock triple in 2025. Congrats to Robinhood—and especially, congrats to HOOD shareholders. Meanwhile in Washington, Elon Musk is saying “no thanks” to an invitation from Trump to a dinner for tech leaders. Sounds tense. The Supreme Court is also determining the fate of Trump’s tariffs—just when the economy thought it had enough drama.
“Good-To-Know’s”
Open Interest vs. Volume — Both metrics help traders gauge liquidity, but they measure different things. Open interest is the number of outstanding contracts that exist for a given strike and expiration. Think of it as the inventory of contracts still open. Volume, on the other hand, tracks the number of contracts traded in a single period (usually daily). It is the flow of trades.
Both metrics are liquidity signals, just on different time horizons. Open interest suggests depth (how many contracts exist to trade), while volume reflects immediacy (how active today’s tape is). In practice, healthier OI and solid volume usually mean tighter bid–ask spreads and cleaner fills.
Along with the level, we want the relationship between the two to be well-balanced. If a put option shows 2,000 in open interest but only 20 in daily volume, that means plenty of contracts exist, but not much trading happened today. Conversely, a contract could have huge volume but low open interest if traders are opening and closing positions quickly.
Ideally, these balance. You don’t want a crazy mismatch. Generally, we look for Volume to be 10%-40% of Open Interest, but this isn’t necessarily a hard and fast rule.
Quote(s) I Like
“Whether you think you can or you think you can’t, you’re right.”
“Nothing is so permanent as a temporary government program.”
Thought Throttle
One of the hardest things in option selling is accepting that some underlyings simply aren’t large enough or don’t have enough liquidity to be viable for trading. It’s not fun to admit, but certain tickers don’t give you a fair shot. As the financial rule goes, if there are fewer buyers and sellers, the market becomes less liquid, and when liquidity dries up, trading costs go up.
Think about it like selling a house. When you go to sell your home, there’s usually one seller (you) and one buyer. That transaction takes time, and the price isn’t always obvious until someone steps up. Real estate is traditionally one of the least liquid asset classes because of these features.
Contrast that with the stock market. Instead of one buyer and one seller, there are hundreds, even thousands, of participants trading all day long. That constant activity creates liquidity, and with liquidity comes important benefits. Among these are faster execution, clearer pricing, and tighter bid-ask spreads.
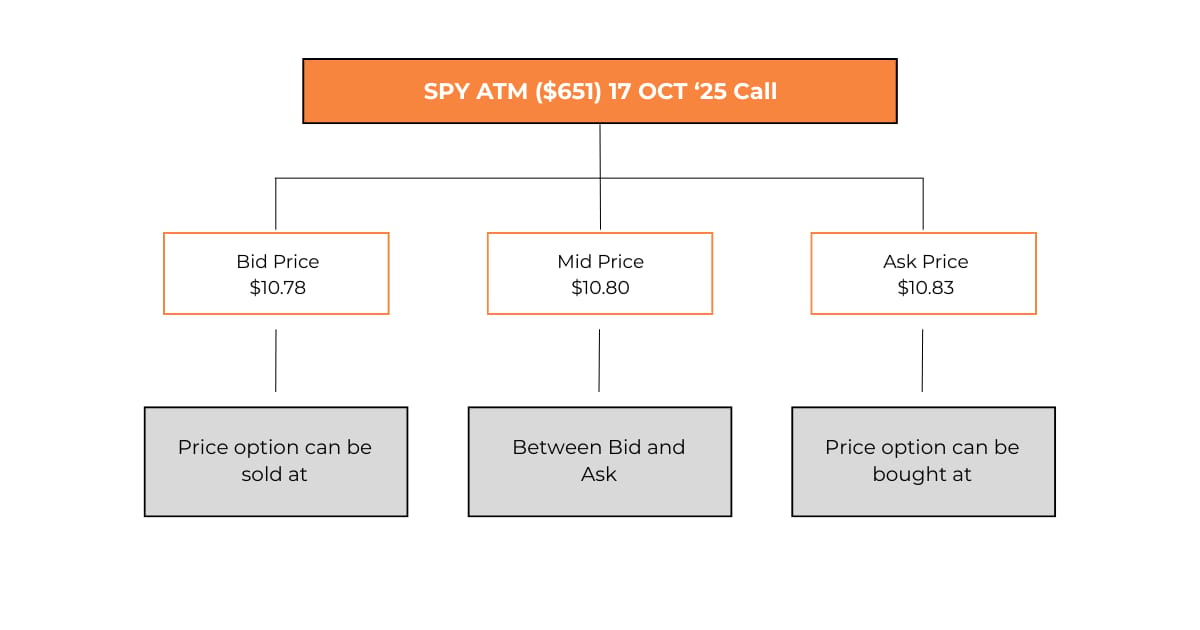
The bid-ask spread is the focus in this edition, as it’s basically a hidden transaction fee made out to the market makers. And it is a fee that a lot of traders don’t pay attention to. The bid is the price you’d receive if you sold an option, while the ask is the price you’d pay to buy it. The gap in between is the bid-ask spread, sometimes shortened to just “spread.”
That gap is how market makers get paid, but it’s also a built-in cost to your trade. If you bought and sold the same option immediately, you’d take a loss roughly equal to that spread. The wider it is, the more you’re paying just to begin.
Let’s Look at a Comparison…
Take SPY. For the ATM Oct 17 Call, the bid is $10.78 and the ask is $10.83. That’s a spread of about 0.46%, tight and efficient. Just what we want to see.
Now compare that to PPTA. The ATM Oct 17 Call has a bid price of $0.45 and an ask price of $0.55, a spread of roughly 18.2%. Not ideal.
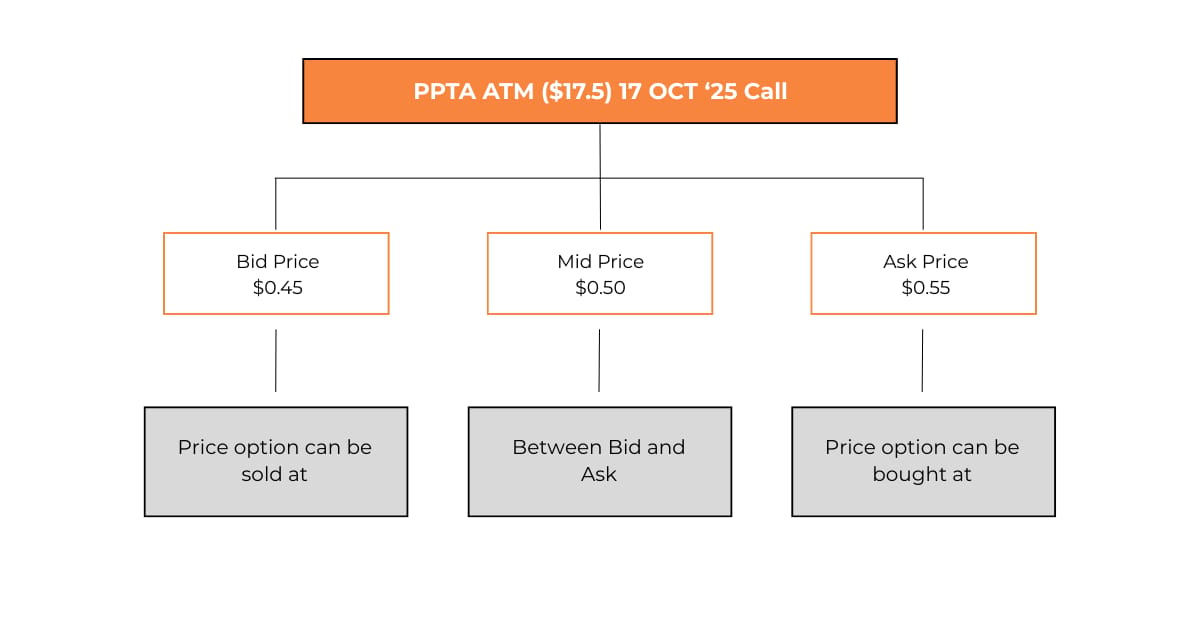
That’s a massive difference, and it highlights why liquidity matters so much. Wide spreads quietly chip away at your profitability before you even get started. And here’s the kicker, this cost doesn’t just show up on single-leg trades. The impact of wide spreads compounds when you move into multi-leg strategies like Jade Lizards, covered strangles, or iron condors.
Every leg you add means paying the spread again. On liquid names like SPY or AAPL, those costs are negligible. But on thinly traded underlyings, they stack up quick, fast, and in a hurry. What looked like a decent trade on paper can turn into a grind to break even.
Note: It is worth mentioning that you’re never guaranteed a fill right at the bid or ask. Most option sellers use limit orders to control execution. After all, the “limit” sets the max you’re willing to pay (shocker, I know).
The Takeaway
Liquidity is more than a convenience. It’s a necessity to consider. It’s one of the most important edges you can give yourself as an option seller. Eventually, when you see a tight bid-ask spread, it will bring a smile to your face.
In most cases, it is best to avoid the wider spreads, especially early on in your trading journey. Consider yourself warned.
Trade Mechanics
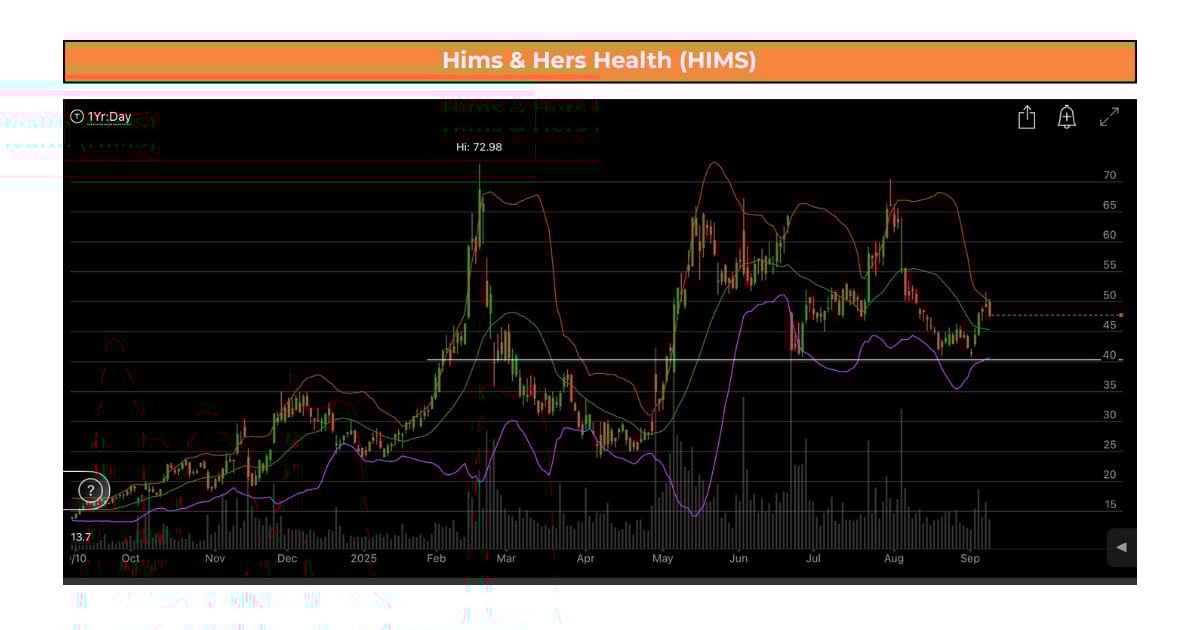
Let’s take a classic, HIMS, and get a closer look at an opportunity for a cash-secured put (CSP).
The details of the trade are summarized below:
Ticker | HIMS |
|---|---|
Current Price | $47.79 |
Put Sold | Oct 17 ’25 $44 (~30 Delta) |
Premium | $2.53 |
Bid / Ask | $2.53 / $2.63 |
Open Interest | 1284 |
Volume | 269 |
Capital At-Risk | $4,147 |
Return if Not Assigned | $253 / 4,147 = 6.10% |
Annualized Return | ≈ 77.0% |
Cost Basis if Assigned | $41.47 |
If we sold the $44 put, we would collect $253 up front on $4,147 of capital at risk, translating to a 6.1% return in just 38 days. This annualizes to about 77%. If assigned, the cost basis comes down to $41.47 per share, giving you a roughly 13% discount from the current market price.
The bid-ask spread here is tight (just $0.10 wide), which is what we like to see. As we talked about in the thought throttle section, this keeps trading costs low and makes execution cleaner. This is especially useful if you need to adjust or roll the position.
This liquidity is also apparent in the Open Interest and Volume. Both of these metrics are solid, along with the relationship between the two. Broad strokes, we want a Volume that is 10%-40% of Open Interest. It is met in this case, as volume is ~20% of Open Interest.
Keep in Mind…
Of course, the trade still carries headline and volatility risk. HIMS is a growth stock, and swings are part of the deal. If assigned, you must be prepared to buy 100 shares at $44 per contract. These are just some of the risks involved in options, making them not suitable for all investors.
Another Idea One…
In this setup, we’re looking at Walmart (WMT). If we think that it will not rise above $105, as it has struggled to break above this resistance level in the past, we can use a vertical spread to set up our trade.

We can structure a bear call spread (aka a call credit spread). The trade involves selling the 17 Oct 2025 $105 Call and buying the 17 Oct 2025 $110 Call. Check the table below:
Ticker | WMT |
|---|---|
Short Call (Sold) | Oct 17 ’25 $105 @ $1.50 |
Long Call (Bought) | Oct 17 ’25 $110 @ $0.46 |
Net Credit | $1.04 ($104) $1.50 received - $0.46 paid |
Cash Required (Spread Width – Credit) | $396 |
Max Profit | $104 |
Max Loss | $396 |
Return on Risk | 26.26% |
Open Interest (Short / Long) | 8,532 / 4,716 |
Volume (Short / Long) | 2886 / 461 |
Bid / Ask (Short / Long) | $1.50–$1.59 / $0.44–$0.46 |
The trade is built by selling the $105 Call for $1.50 and buying the $110 Call for $0.46. That nets us a credit of $1.04 per share, or $104 total. Since the spread is $5 wide, our maximum risk is $3.96 per share ($396)—calculated as $5.00 gap - $1.04 net credit.
If Walmart stays below $105 through expiration, we keep the $104 credit. That works out to a 26.3% return on risk in just 38 days. Obviously, with the higher expected return, you should also suspect a higher chance of loss.
Liquidity looks solid here. The volume and open interest are at good levels, along with very manageable bid-ask spreads. It is $0.09 wide on the $105 option and only $0.02 wide on the $110 option. As mentioned earlier in this edition, those spreads matter in this 2-leg structure. With WMT’s strong option liquidity, it would start us from a fairly efficient place.
Why a Vertical Spread?
The versatility of a vertical spread is that the trade caps both sides. The most you can earn is the $104 credit, and the most you can lose is $396 if Walmart closes above $110 at expiration. The return profile is attractive, but the trade does hinge on Walmart respecting its resistance level. If the stock breaks through $105 decisively, you’ll need to be comfortable managing, adjusting, and (hopefully not) losing.
Again, options have incredible risk, so make sure you know what you are doing.
If you want to dive deeper into vertical spreads, check out this previous edition:

This is for educational purposes only—not a trade recommendation. Remember to always do your own due diligence and consult a financial advisor before making investment decisions.
Throttle Q&A
Why Do Wide Bid–Ask Spreads Matter More for Multi-Leg Strategies?
Because every leg of a multi-leg trade incurs the spread cost. Wider spreads in less liquid underlyings can quickly erode profitability. Tight spreads are crucial for clean execution and return efficiency. To see this in action, you can go to your brokerage platform and add multiple legs to a paper trade. When you add additional legs, you can watch the effect on the bid-ask spread in real time. This is a crucial consideration.
Does a Lower Percentage Return Mean a Worse Trade?
Not necessarily. The ideal return depends on your risk appetite, along with other factors focused on in personal finance. Higher returns often come with higher volatility and risk. Lower returns could still be a better overall fit for you if they align with your goals and comfort level with risk. As in most of finance, it is about the dance between risk and reward.
To All Theta Throttle Subscribers…
One of the hardest parts of putting together each edition of Theta Throttle is deciding what to write about. Seriously—if there’s a topic you’re curious about or something you want me to dive into, just reply to this email. There’s a very good chance it’ll become its own edition. Let’s build.