- ThetaThrottle
- Posts
- Annualized Returns
Annualized Returns
Weekly Edition: March 4th, 2026
Market Movements
Current Level | Weekly Return | YTD | |
|---|---|---|---|
S&P 500 | 6,816.63 | -1.425% | -0.42% |
NASDAQ | 22,516.69 | -2.123% | -3.12% |
Dow Jones | 48,501.27 | -1.735% | 0.91% |
VIX | 23.57 | 20.316% | 57.66% |
Russell 2000 | 2,608.36 | -1.982% | 4.31% |
*Weekly Return is calculated as market open of the previous Wednesday, to market close this Tuesday (yesterday); Current Level is Tuesday’s (yesterday’s) close.
Weekly Rollout
Markets are down, largely thanks to the Iran situation
This Iranian conflict is also expected to push global inflation higher
Fed officials are warning that inflation is too hot to cut rates
There is less than a 3% chance that rates are cut at the meeting on the 18th
Industrials are learning what “macro headwinds” mean
“Good-To-Know’s”
Reinvestment Risk — This is the risk that future returns will be lower than the current rate of return, particularly when cash must be redeployed repeatedly.
In many cases, calculated and projected returns assume you can reinvest capital immediately at the same rate of return. The math compounds cleanly.
But reality is muddier.
Premiums fluctuate with volatility. Liquidity shifts. Attractive setups disappear. What worked this month may look very different next month.
The shorter the duration of the trade, the more amplified this effect becomes. This is because capital must be recycled much more often to achieve the projected annual figure.
Quote(s) I Like
“The first rule of compounding: Never interrupt it unnecessarily.”
“There is a strong tendency to get used to and accept very bad things that would be shocking if seen with fresh eyes.”
Thought Throttle
Why do we care about annualized returns?
Because most performance numbers are quoted annually.
Funds report annual returns. Advisors talk annual returns. Retirement projections assume annual returns.
If we want to compare strategies, we need a common denominator. Annualizing gives us one.
But first, the basics…
At its simplest, a return is straightforward.
You invest capital. You earn income or appreciation (if you wait long enough). You divide the profit by your original investment.

That’s your basic return.
If you buy a stock for $100 and sell it for $110, that’s a 10% return. Simple enough.
But what if that trade only lasted 90 days?
That’s where annualization steps in.
We convert shorter-term returns into an annual figure so we can compare apples to apples.
Formula for Annualization:
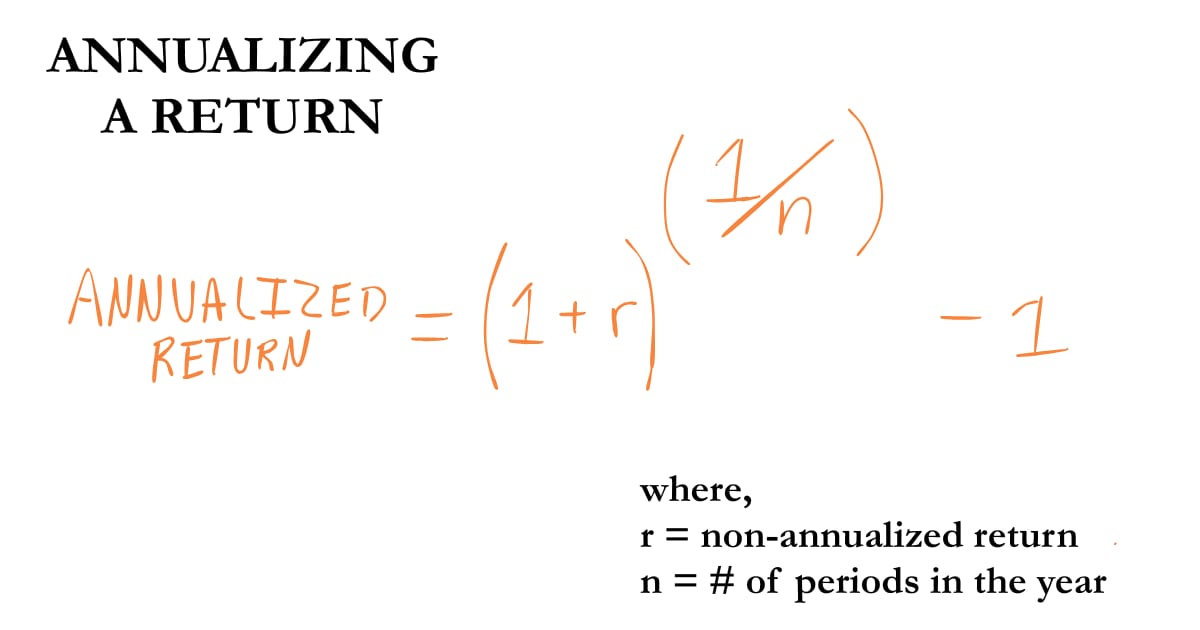

To use our previous example, if we earned 10% in 90 days, this formula shows what that return would look like if repeated for a full year (if we returned 10% in 90 days about four times for the year).
This is an annualized return of 47.19%—calculated as (1+.10)^(365/90).
It’s compounding getting us to the comparative annual rate. And it’s useful.
It lets us compare:
A 45-day option trade
A 7-day earnings play
A 6-month bond
A dividend stock yielding 4% annually
All on the same scale. But here’s where balance comes into play.
Higher annualized returns come with a higher risk.
More return = more risk.
We also have to note that you can make almost anything look impressive when compressed into a short timeframe.
A 1% return in 5 days annualizes aggressively (3,422% annualized).
Does that mean it’s sustainable? Does that mean it’s repeatable? Especially over the course of a year or longer?
No way.
Annualization also assumes you can redeploy capital immediately.
At the same return. With the same risk profile. Over and over again.
Markets don’t work that cleanly.
Opportunities come and go.
See Reinvestment Risk above.
Annualization also ignores something called tail risk.
One horrendous loss can wipe out many, many small “annualized” wins.
Extreme, low-probability events don’t show up in smooth compounding math.
They show up very quickly in real portfolios, however.
So, what is an annualized return, really?
It’s a comparison tool. A projection or a lens for perspective.
It is not a promise.
Used properly, it can provide context to a return and sharpen decision-making.
Used stupidly, it can make ordinary trades look extraordinary, or make lucky trades look like they should be overweighted.
Be smart and careful.
Trade Mechanics
Let’s look at two opportunities for cash-secured puts. One in Tesla Inc (TSLA) and one in Microsoft Corp (MSFT). Each strike below represents roughly the 30-delta put expiring April 17th, 2026.
Tesla Inc (TSLA)

Microsoft Corp (MSFT)

Let’s take a closer look:
TSLA | MSFT | |
|---|---|---|
Current Price | $392.43 | $403.93 |
Put Sold | Apr 17 $365 (~30 Delta) | Apr 17 $385 (~30 Delta) |
Mid-Premium | $12.95 | $9.03 |
Capital At-Risk | $35,205 | $37,597 |
Return if Not Assigned | $1,295 / $35,205 = 3.68% | $903 / $37,597 = 2.40% |
Annualized Return | ≈ 34.05% | ≈ 21.23% |
Cost Basis if Assigned | $352.05 (~10.29% discount) | $375.97 (~6.92% discount) |
If we wanted to buy Tesla Inc (TSLA) at a discount, we could sell the $365 April 17th Put for about $12.95 in premium. With shares trading near $392.43, that’s roughly a 3.68% return on risk over 45 days, and a 10.29% discount from the current price if assigned.
For Microsoft Corp (MSFT), selling the $385 April 17th Put yields a $9.03 premium with shares trading near $403.93. That’s a 2.40% return on risk over the same timeframe and a 6.92% discount from the current price if assigned.
Keep in Mind…
Premiums fluctuate with volatility, earnings cycles, and investor sentiment. Returns assume smooth expiration and no early assignment. Wider spreads may appear on less-liquid strikes. Both positions require roughly $30k in collateral and reward patience over prediction.
This is for educational purposes only—not a trade recommendation. Remember to always do your own due diligence and consult a financial advisor before making investment decisions.
Throttle Q&A
What is the Rule of 72?
The Rule of 72 is a quick and easy way to estimate how long it will take for an investment to double in value, based on a fixed annual rate of return.
To use it, you simply divide the number 72 by your annual return rate. For example, if your investment earns 6% per year, dividing 72 by 6 gives you 12, meaning it would take about 12 years for your money to double.
While it’s not perfectly precise, especially for very high or low rates, it gives a surprisingly accurate estimate for reasonable returns. Use it as a rough way to visualize the power of compound growth and how small differences in returns can have a big impact over time.
Dangers of Compounding
While compounding is often celebrated for its wealth-building power, it can also work against you when returns are negative. Just as gains can build on gains, losses can compound too.
Let’s say you have $100,000 and lose 20%—your account drops to $80,000. To get back to $100,000, you now need a 25% gain, not just 20%. That’s compounding working against you—each loss requires a disproportionately larger gain to recover.
This further points to the crucial nature of risk management and selecting high-probability trades.